Andy Kirk defines four stages of data visualisation:
- Formulating your brief
- Working with data
- Establishing your editorial thinking
- Developing your design solution
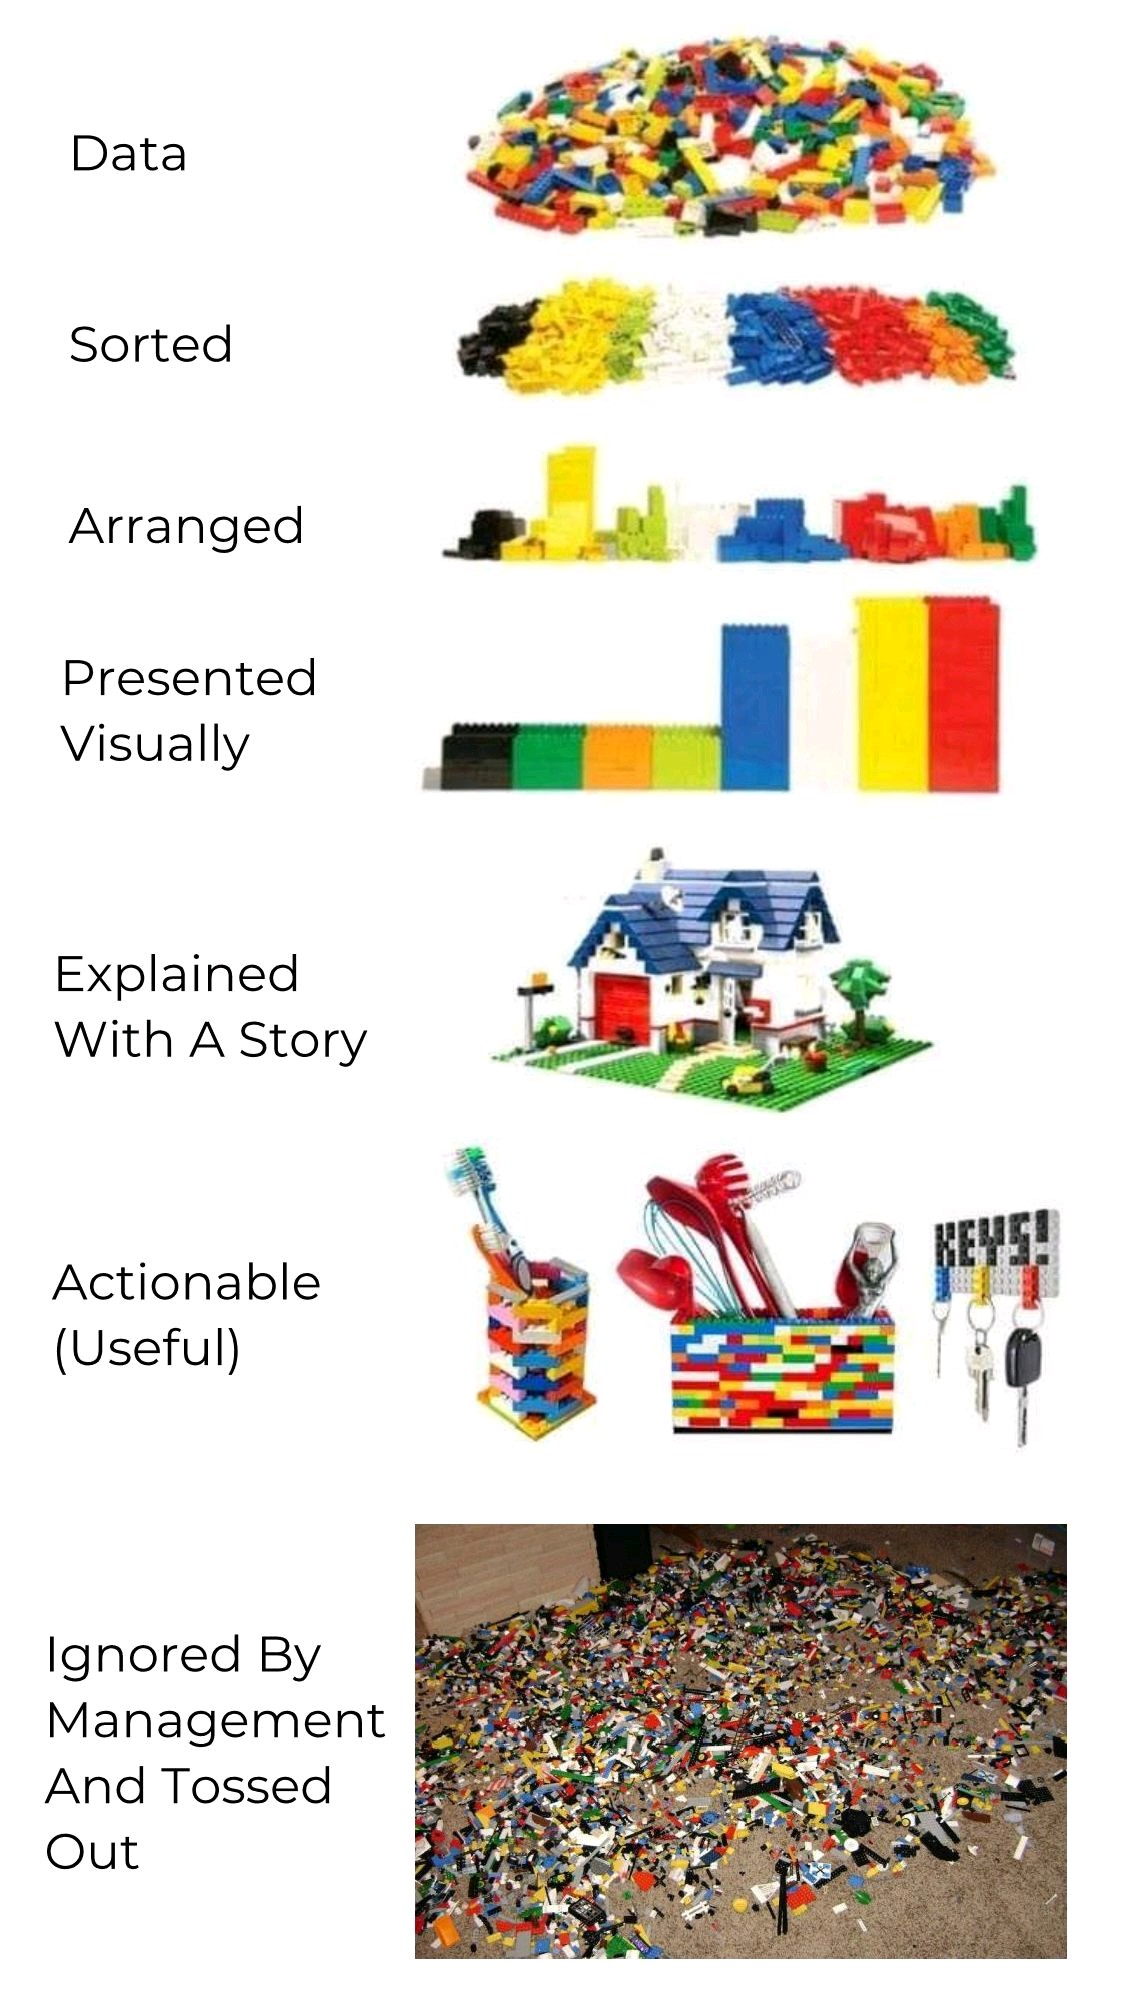
But you you can think about visualisation as balancing several axes:

However, it doesn't always work as hoped: